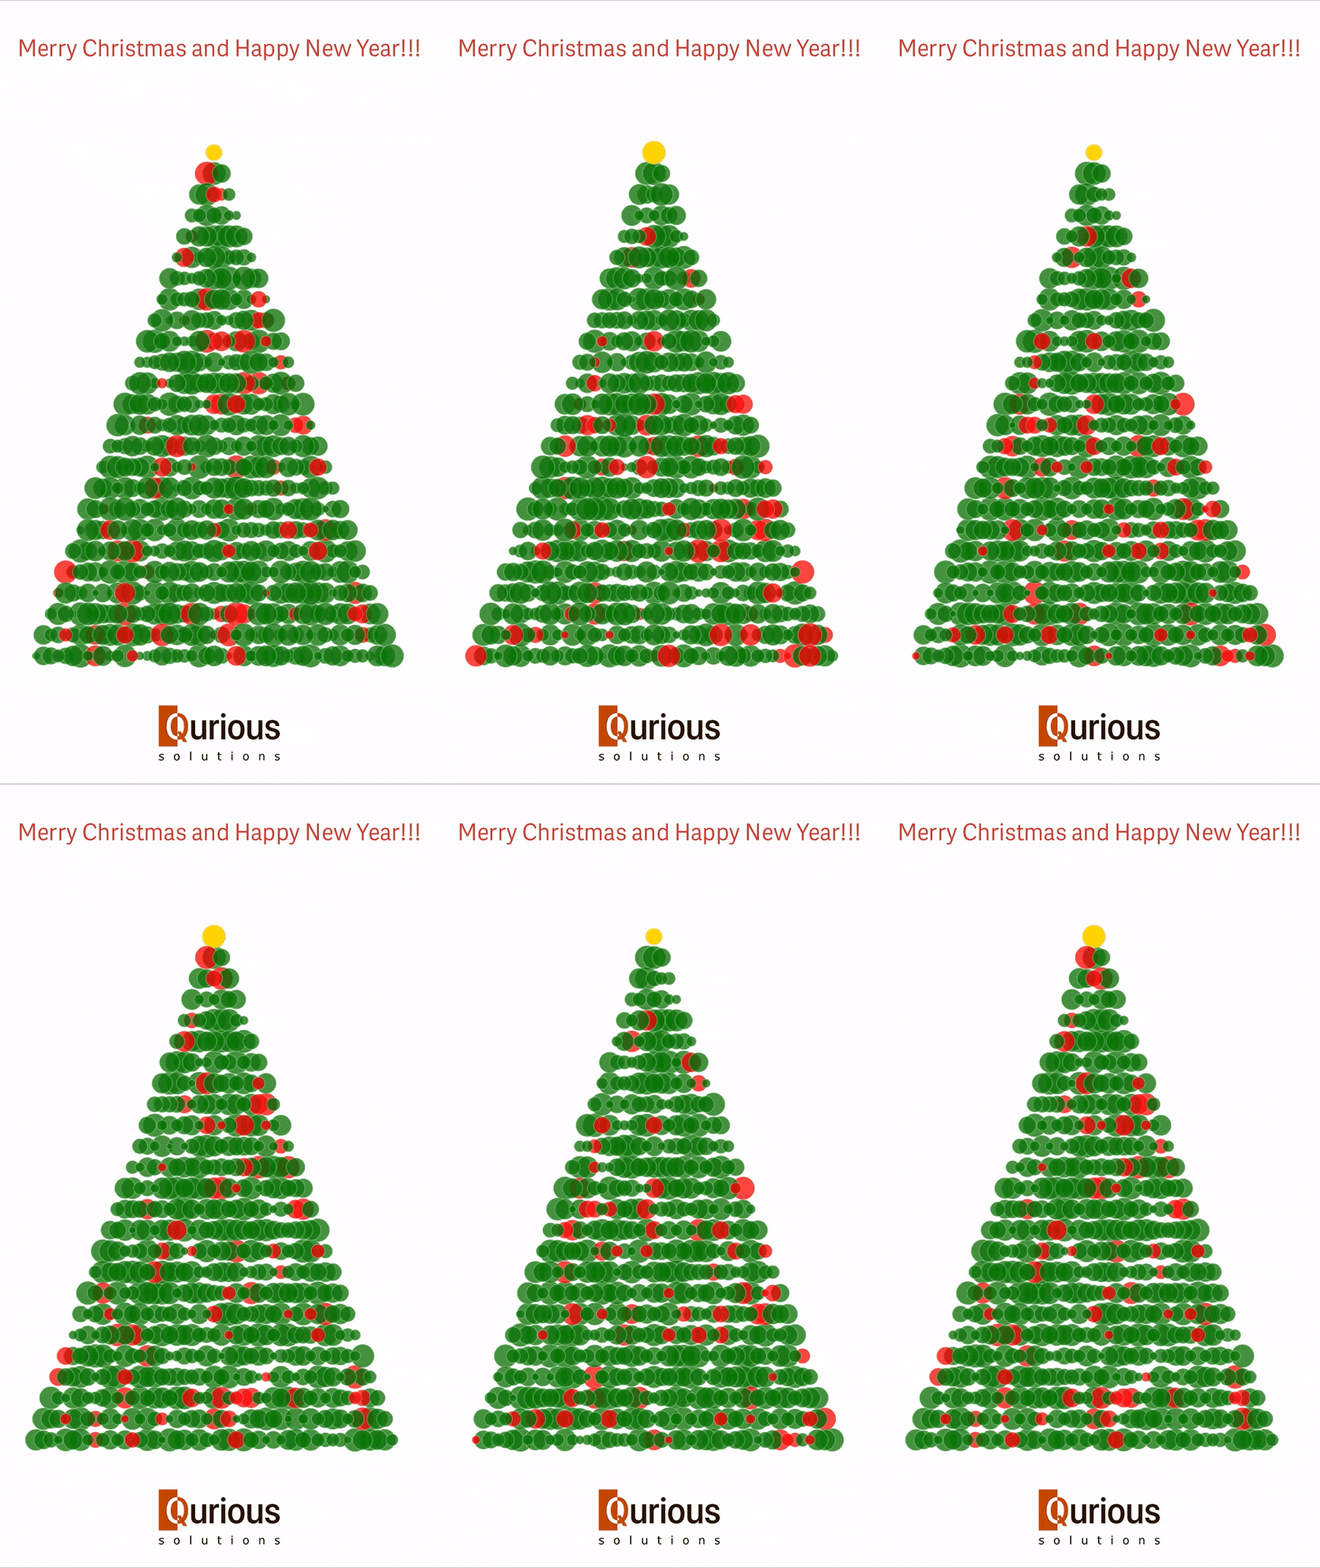
Christmas Tree in Qlik Sense®

You can have one like that in any of your applications
The recipe is pretty simple:
- Create a New app.
- Add the following code as Load script:
SET xSize=51; //Play with the value to get required tree density
 For i.Y=1 to $(xSize);
    For i.X=1+$(i.Y) to $(xSize)-$(i.Y);
      Tree:
      LOAD 1 AS Value,
             $(i.Y) AS Y,
             $(i.X) AS X,
      RowNo() AS RowId
      AutoGenerate (1);
    Next i.X
Next i.Y

[Scroll]:
LOAD * Inline [
Scroll
1
2
];
- Reload data and go to Analyze section
- Add a Scatter Plot chart
- Set Dimension is RowId
- Set First Measure Sum(X)
- Set Second Measure Sum(Y)
- Set Third Measure Sum(Value)*Rand()
- Use the following expression to get Colouring
IF(X=Median(TOTAL X) and Y=Max(TOTAL Y), '#ffd900',
IF(Column(3)>0.9,lightred(),green(200)))
5. Add an Animator extension from the Qlik Dashboard bundle (from Sep 2020) to make it flickering.
Use Scroll as Dimension.
Press Play button and enjoy!
Merry Christmas and Happy New Year


