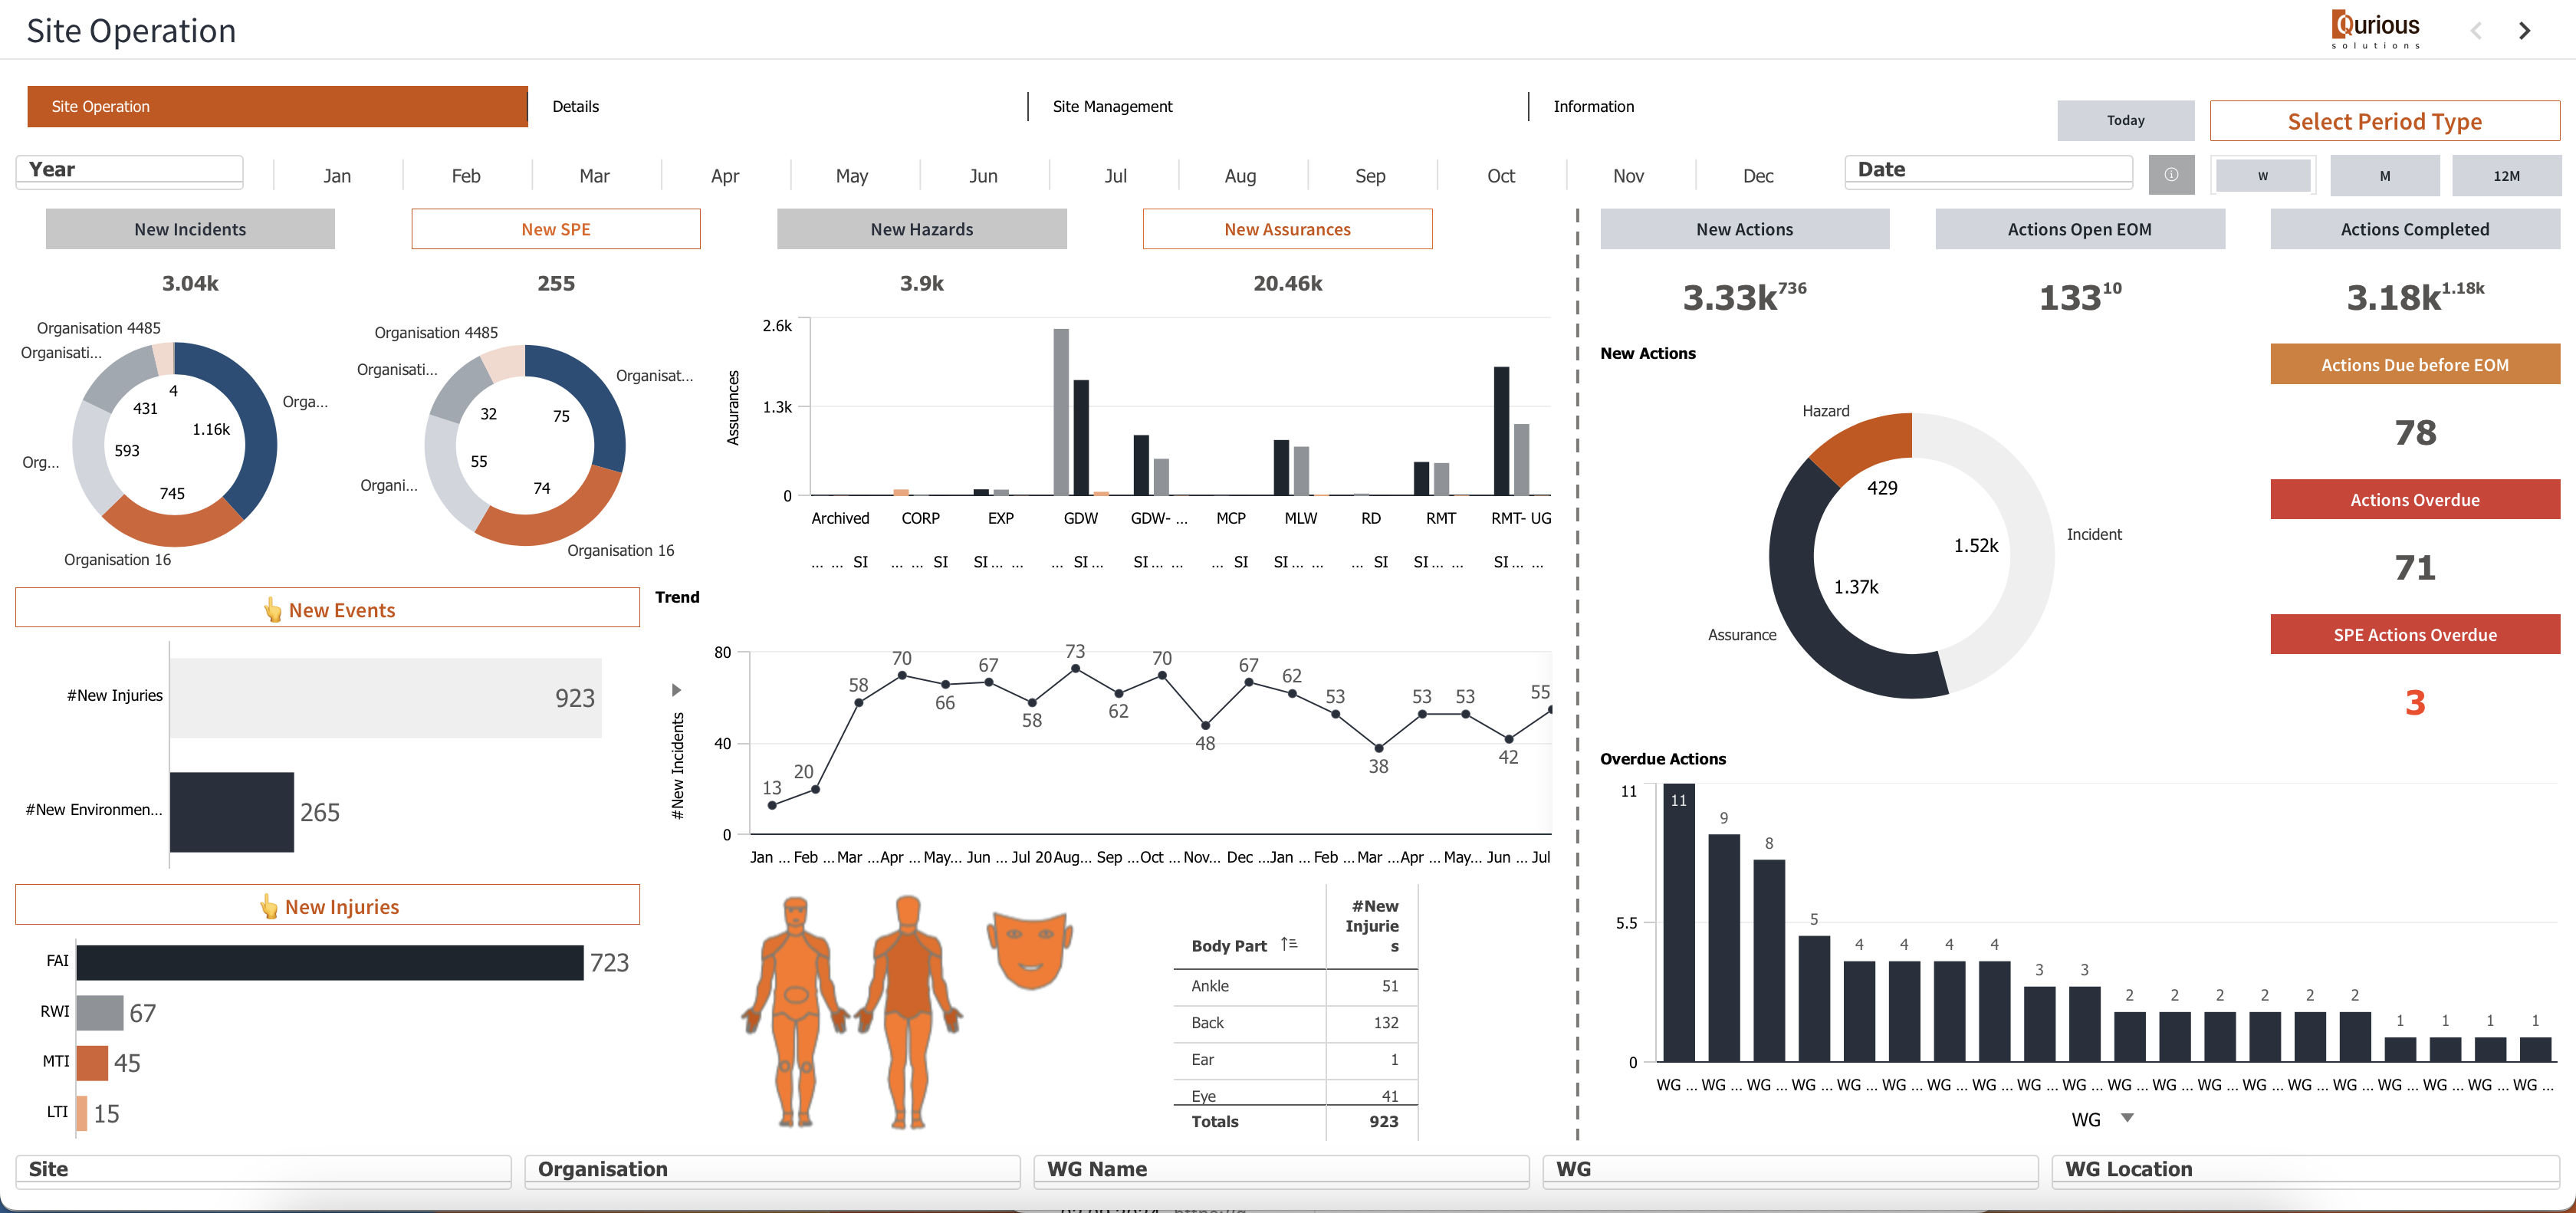
Blog

Blog

Creating an Excel report with the Qlik Add-in

In the past, nPrinting was utilised to generate pixel-perfect reports in Qlik, but Qlik nPriting doesn’t work with Qlik Cloud. Now, with the Qlik add-in, Excel templates offer more flexible data export options.

Qlik Add-in for Excel allows to build templates in Excel that are used to generate reports on the fly using Qlik data, but present it in any way Excel can do that: tables, charts, conditional formatting etc.

In addition to that, Layers and Paging features allow you to speed up your report development as the same format can be repeated for each value of the page or level value. For example, you can quickly build all tables with $Amount by Activity for each Department by simply using Department as Level.

However, it’s recommended to leave the in-depth drill-down functionality in Qlik, while using Excel/PDF as an additional presentation layer.

Data can be added as:

        -Chart images;

        -Column-level tabular data from a chart;

        -Variables defined in the source Qlik Sense app;

        -Expressions using the native Qlik Sense calculations;

        -Native Excel calculations applied to tabular data

Adding Data to the Report


By using the Add-in panel, objects from multiple sheets could be added

 to the Report Template.  


Charts


are added as pictures with the predefined selections and filters in the original app source.

Variables and expressions


can be used to dynamically store a value or calculation that can be centrally modified and reused across a report.


Tabular Data

The Qlik add-in for Excel allows users to format tabular data within reports, enabling customisations like maintaining source formats, expanding ranges, and wrapping text. Users can adjust these settings at the table or column level, ensuring data appears correctly in generated reports. This flexibility supports manual styling and ensures data integrity when applying calculations or altering formats. 


Levels and Pages

Levels and pages are added as objects to report templates created using the Qlik add-in for Excel. For each unique value in a field (or row-level combination in a chart), levels and pages generate a new filtered section or worksheet. In addition to the report filters available in Qlik report tasks, levels and pages give reports an extra layer of data filtering. 

Configuration and Distribution

The task-based report generation in Qlik Sense allows users to centrally manage report tasks, schedule report runs, and distribute outputs to recipients via email or folders. Users can configure report templates, apply filters for data reduction, and define distribution lists for personalized reporting. Reports can be triggered manually or on a schedule.


Live Demo

The video below provides a live demonstration of how to create a Financial Report using the Qlik add-in for Excel

Leave a comment

Your email address will not be published. Required fields are marked *

More To Explore

Q3-2024 WA Qlik User Group

Q3-2024 WA Qlik User Group Meetup What’s New in Qlik? How to navigate time period. Pixel-perfect reporting in Qlik Sense. The Qlik User Group held its

qlik answers

Introducing Qlik Answers™

Introducing Qlik Answers™, a new knowledge assistant to deliver personalised, relevant insights from unstructured data What is Qlik Answers™? Qlik Answers is a plug-and-play, generative

The website uses cookies to ensure  you get the best experience on our website. To find out more read our Privacy Policy