Work Smarter. Stay Safer

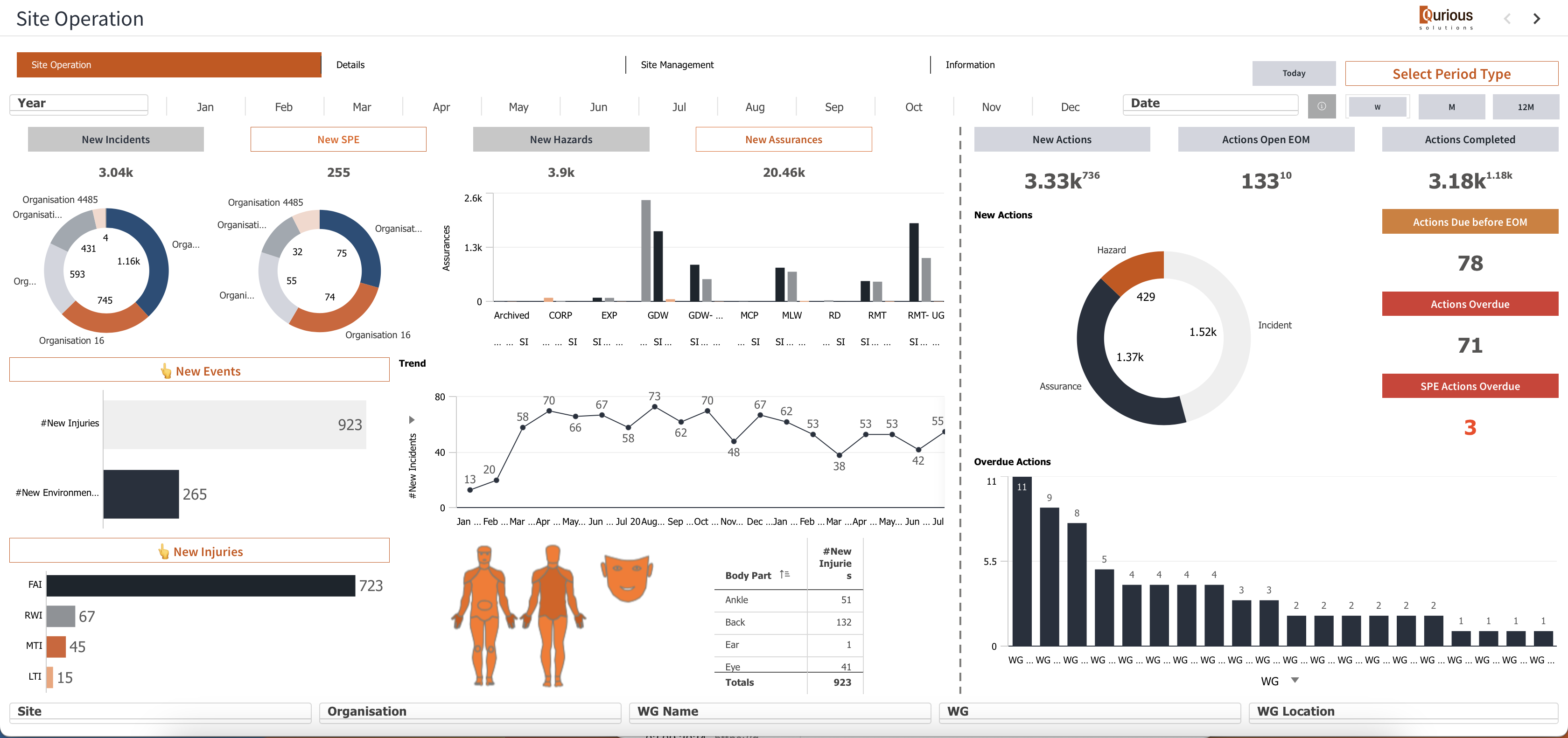
Is Your HSE Data Working for You? Every day, organisations generate vast volumes of data—from safety inspections and incident reports to environmental monitoring and training records. But despite its value, much of this data is often underutilised.   https://qurious-solutions.com.au/wp-content/uploads/2025/04/Screen-Recording-2025-04-11-at-09.57.04.mov#t=12 That’s where data consolidation becomes crucial. When you bring all your HSE data together in one place, you… Continue reading Work Smarter. Stay Safer

Pixel-perfect reporting with Qlik add-in in Excel

Creating an Excel report with the Qlik Add-in In the past, nPrinting was utilised to generate pixel-perfect reports in Qlik, but Qlik nPriting doesn’t work with Qlik Cloud. Now, with the Qlik add-in, Excel templates offer more flexible data export options. Qlik Add-in for Excel allows to build templates in Excel that are used to… Continue reading Pixel-perfect reporting with Qlik add-in in Excel

Improving information density in the tables in Qlik Sense​

Qlik Sense Dense Table

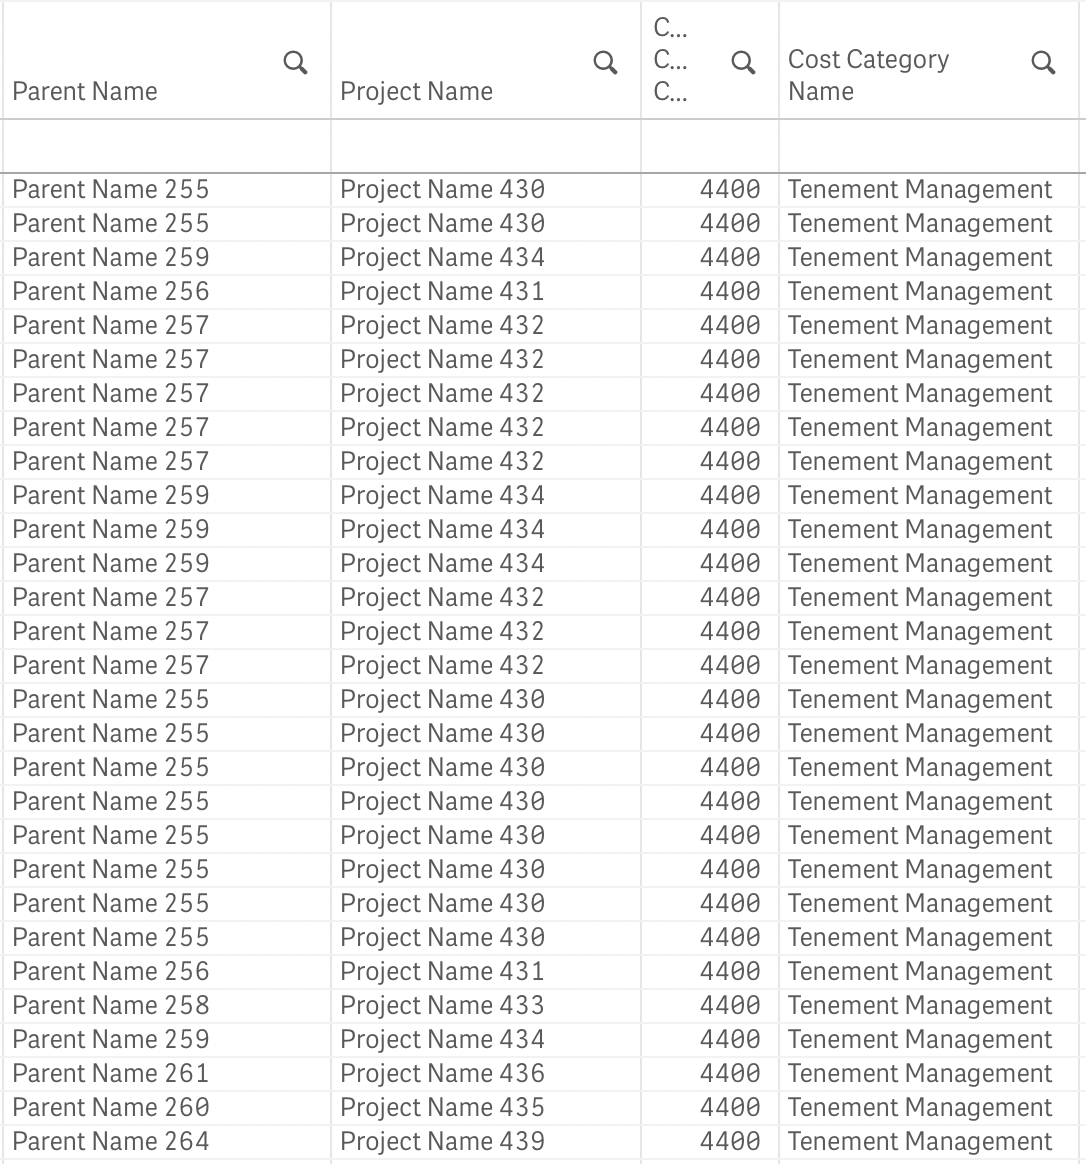
Improving information density in the tables in Qlik Sense Many clients have mentioned that standard tables in Qlik Sense seem to contain less information compared to QlikView. A typical Qlik Sense table looks less dense compared to its QlikView counterpart, as shown in the screenshots. Qlik View table Usual Qlik Sense Table I attempted to… Continue reading Improving information density in the tables in Qlik Sense​

A simple way to improve the Performance of Financial Reports in Qlik

Financial Report

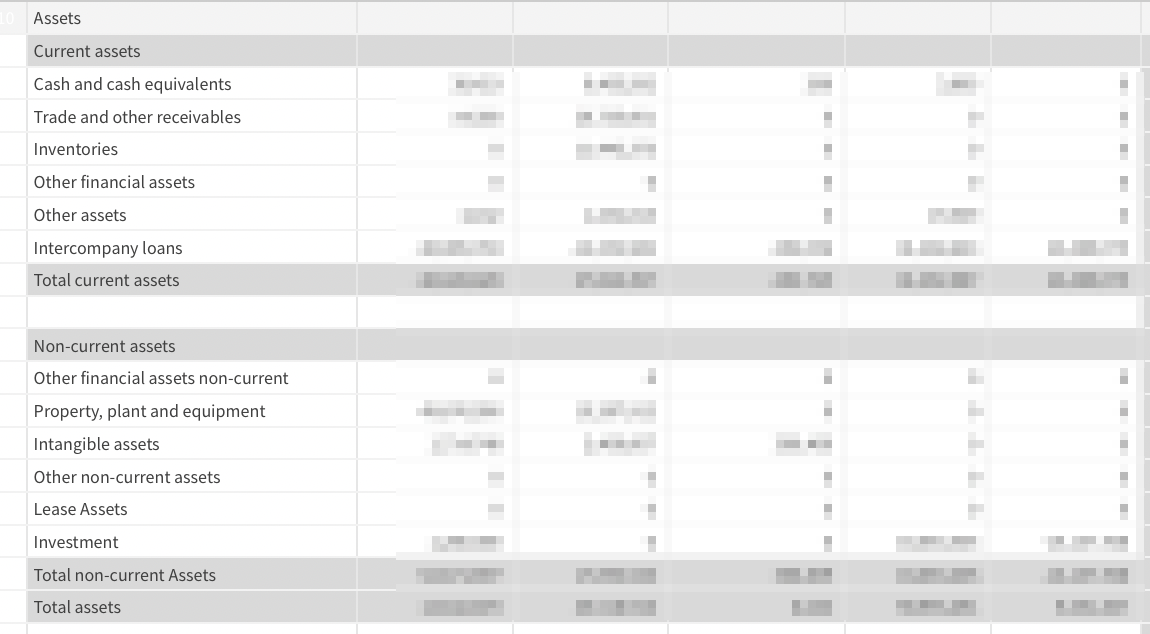
Simple way to improve Performance of Financial Reports in Qlik Financial reports are critical for any organization, as they provide a clear picture of the organization’s financial health. In today’s fast-paced business environment, it is essential to have financial reports that are not only accurate but also easily accessible and timely. Qlik is a powerful… Continue reading A simple way to improve the Performance of Financial Reports in Qlik

Nodegraph presentation

What can we do to increase the trust into data A couple of weeks ago, I had an opportunity to present the Nodegraph tools to Qlik community of Western Australia at our quarterly meeting. Here I would like to share with you some key points from the presentation. We all have to admit that the… Continue reading Nodegraph presentation

The website uses cookies to ensure  you get the best experience on our website. To find out more read our Privacy Policy