What can we do to increase the trust into data
A couple of weeks ago, I had an opportunity to present the Nodegraph tools to Qlik community of Western Australia at our quarterly meeting.
Here I would like to share with you some key points from the presentation.
We all have to admit that the data is getting more and more important and used in the modern world. Together with that, the Data Trust is becoming the first and probably one of the main concerns in organisations.
When I asked the participants of the event if they Can trust the data they are working with, the opinions were equally divided.
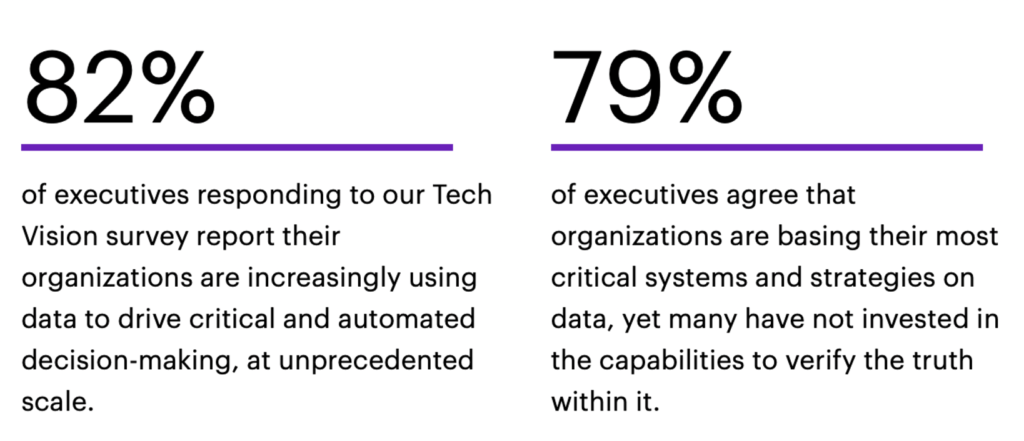
According to research conducted by Accenture, 79% of executives agree that they have not invested in the capabilities to verify the truth within the data.
Another critical concern is Data Quality.
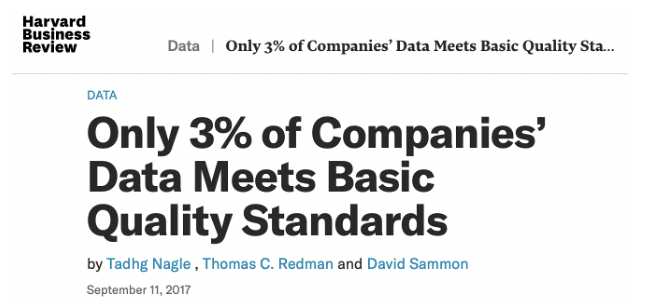
There is an opinion that only 3% of Companies’ Data meet basic quality standards.
One of the reasons for those concerns is the number of layers where data is being loaded and transformed.
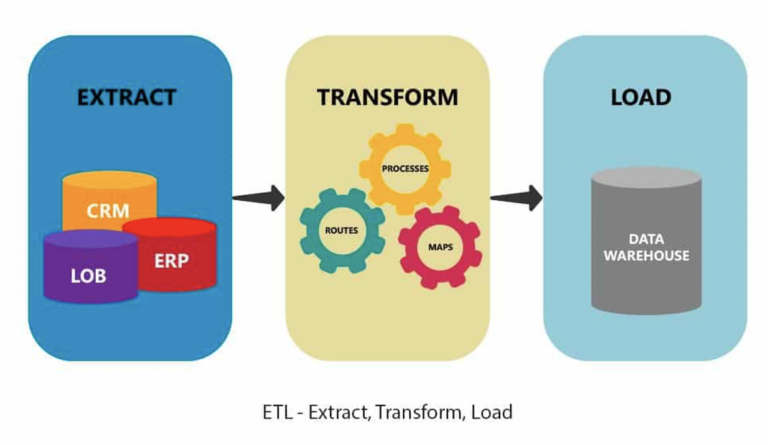
Typically, companies have at least three layers in Data Warehouse: so-called Extract Transform Load (ETL).
Ideally, on top of that, we put another three layers in Qlik (or another BI tool) when we use the 3 tier approach according to the best practice in Qlik.
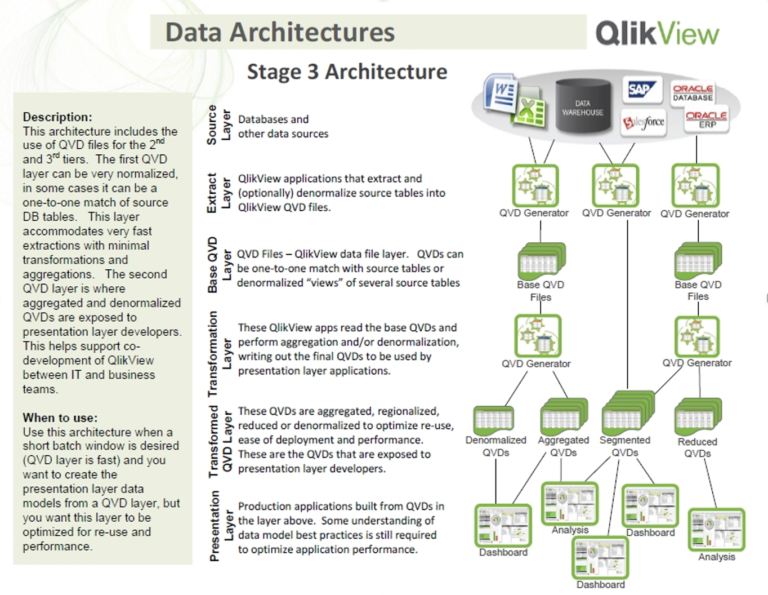
Quite often, I have to re-develop the applications created by other developers when the business logic was spread across a number of other applications. Take a look at the example below.
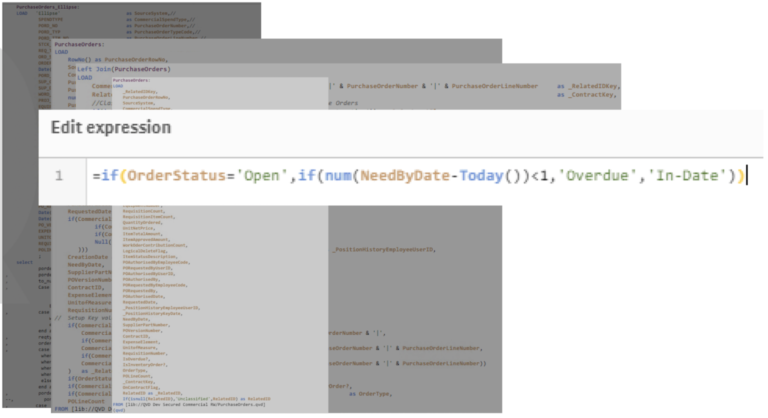

In that example, you can see five layers of data transformation of the same data just in Qlik, including transformations in the UI that changed the data in Expression.
All of that leads us to the root of the problem and raises a big question: What can we do to improve Data Quality and make sure that people do trust their data?
One of the options is to use special tools. This is where Nodegraph can play its role.
Let’s take a closer look at some of its tools.
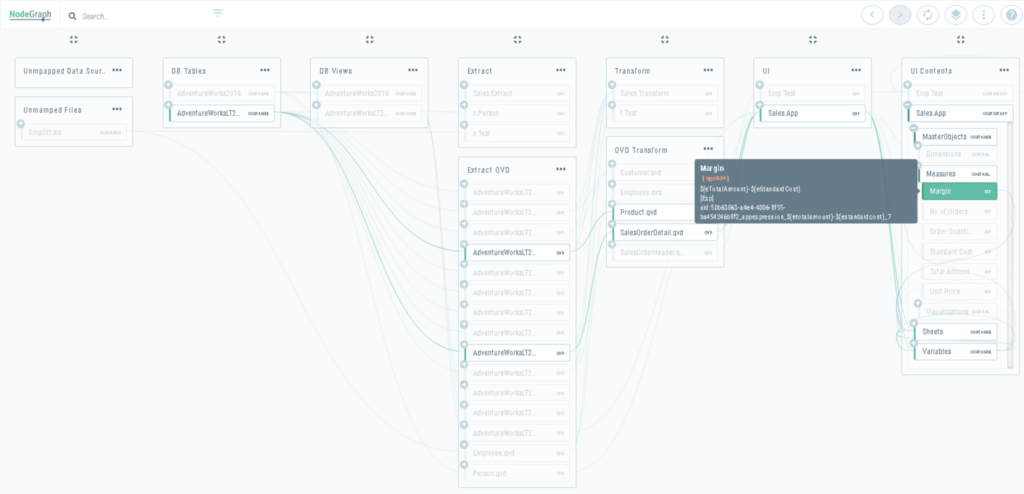
Dependency Explorer in Nodegraph 4 helps to understand data lineage in Qlik as well as on the database level. It allows users to see what tables and fields were used to create the database view, that was used to develop Extraction QVD files, which then is used to transform the data, store it in Transformation QVD files and used it User Interface Application in the dimensions, measures, master objects and variables.
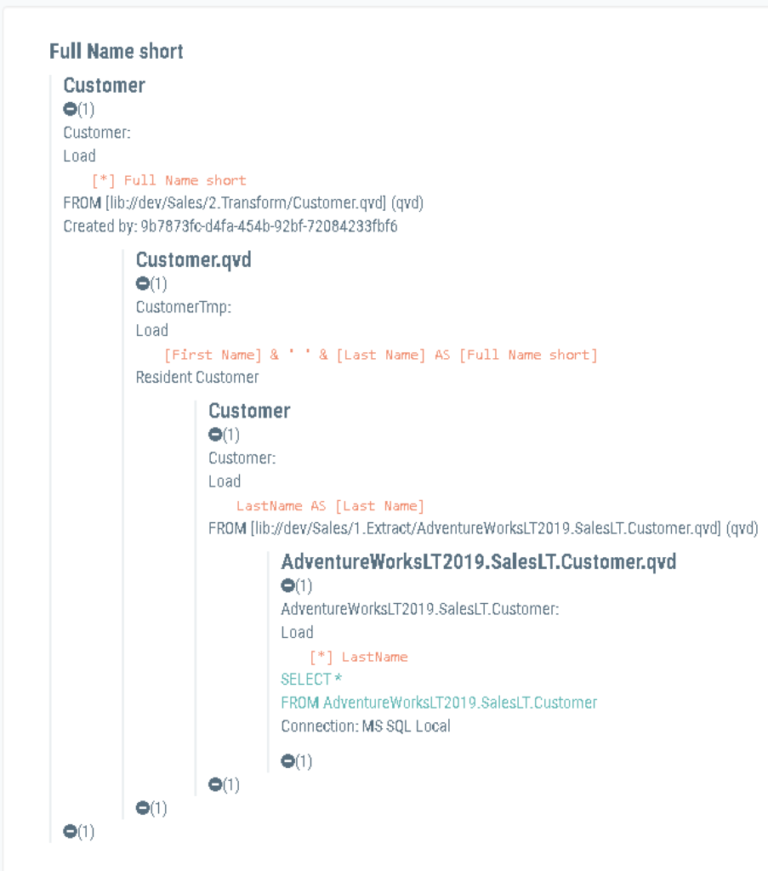
Field Explorer gives you the details on how any particular field in your User Interface app has been transformed on the way to the users.
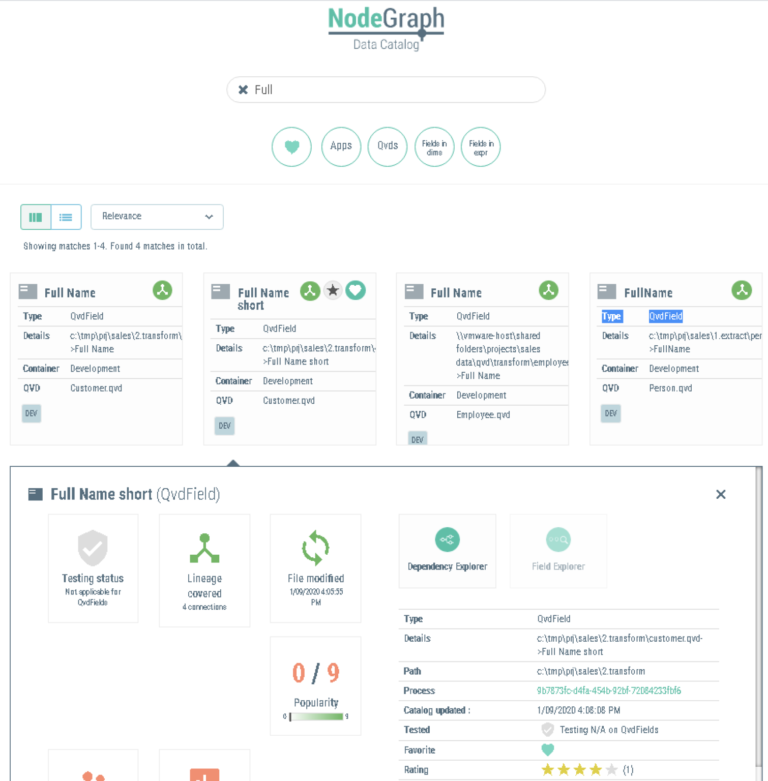
Data Catalogue in Nodegraph has a google-like search that helps to find any keywords and see some metrics like how popular is the data, what is the result of the data testing. It enables people to leave comments, add the rating on the fields, files and applications etc.
Data Quality Manager allows you to create all sorts of Data Quality tests for the data in your Qlik environment or the Database.
As you can see all Nodegraph tools are increasing the visibility of
- what’s available to the user and developer
- how the data have been transformed on the way
- what is the data source
- data lineage comparison of several measures as quite often the calculation of the measure with the same name might be different
Thus, it doesn’t improve the Data Quality by itself, but it makes it easier to find the Data Quality issues and fix it.
With the help of Nodegraph tools, the Trust in the Data can be improved because
a) it allows the developers to track and compare the data elements with ease
b) users can see the data lineage themselves and be sure that the information they see is based on the data from their system, but not on the “another Excel spreadsheet”.
In addition to all mentioned features, Nodegraph also allows generating the documentation on the schedule, which improves the compliance subsequently.
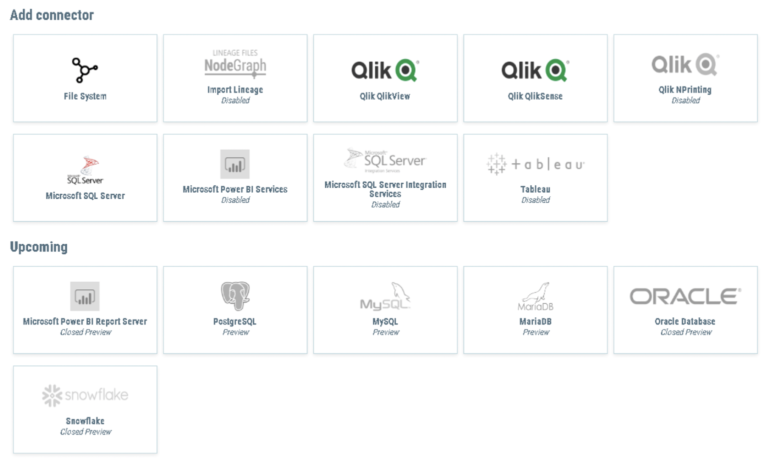
I should add that Nodegraph also works with Tableau, Microsoft Power BI, MS SQL Server and MS SSIS. It will also have the following connectors for preview: PosgreSQL, MySQL, MariaDB, Oracle Database and Snowflake.
As a cherry on top, we should add that there is a possibility to use Nodegraph API and embed the results of the tests, users comments, rating etc. into other tool and even have it in Qlik.
If you have any questions, send us a message to [email protected]

