
What you need to know about building a business dashboard
Seeing the business at one glance is a dream of almost every executive whose aim is to succeed in developing and growing a healthy and strong company. As a captain of a business ship, they want to be able to see, track and analyse any information coming from inside or outside of that ship. The presented data must be relevant, clear, available and accessible exactly when they need it.
The requirements for an ideal business dashboard include:
- to present all the required data including the most recent one;
- to give all necessary comparisons and drill-down to even the smallest detail if necessary;
- do not require any interaction from a user;
- to provide an instant insight even for a person who is not really into the topic of the business.
Unfortunately, I have to admit that an ideal world exists only as a theoretical model as well as an ideal dashboard.
But how can we bring it to live? Is there a recipe or guide that can lead us step-by-step to the most efficient and informative dashboard?
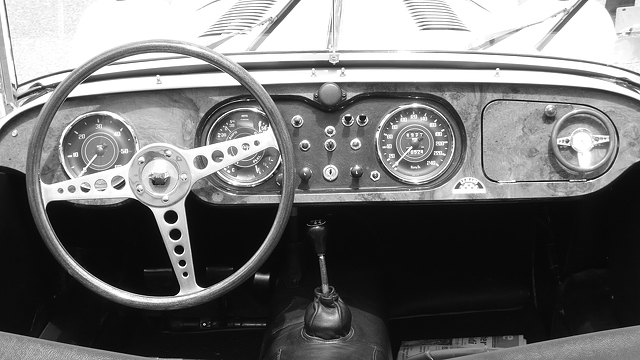
One of the common ideas is that a good dashboard should be as simple as a vehicle dashboard which shows only the most critical and informative parameters like Speed, Engine RPM, Amount of Fuel left etc.
Locking at a vehicle dashboard as an example, I can say that it wouldn’t be enough to have only the essential information. Besides that, I would like to see more details about the trip and the vehicle itself like Current Trip distance, Fuel Consumption, Cruise Control Speed etc.
All the additional information is not displayed simultaneously. We can get access to it through some handles, buttons and other controls on the steering wheel.
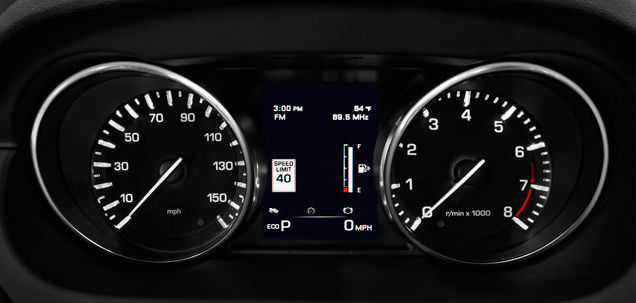
Having a closer look at the evolution of vehicle dashboards, you can see that not many things have changed for the last 50 years. Despite being able to access much more information, modern vehicle dashboards are still easy to read and understand.
Thus, the old recipe to get closer to the ideal dashboard is to reveal and present only the very essential parameters for your business, keeping the dashboard simple and easy to read.
When we talk about the business development and leading of a business, the executives are the people who usually have or would like to get a deeper understanding of the business processes as well as get better control over them.
So, in that case, a better comparison to our business dashboard would be an aeroplane’s one, and it wouldn’t look so simple anymore.

It’s likely to have all the required data, with lots of details. As a business management process, it also involves some interaction from the user to get some additional information. In that case, the dashboard would probably look overcrowded, hard to navigate and taking to much efforts from the user to access the necessary information.
At the same time, we understand that we have to keep the dashboard simple and make sure that only essential and necessary information presented in an easy to read and understand way.
What can you do when you can’t limit the number of parameters have to be present on the business dashboard? The recipe is to back out of the traditional practices and recommendations to create a car-like dashboard and to become creative and invent the way your data would be able to speak for itself. It doesn’t matter which application you are going to use to create one: Qlik, Tableau, Power BI or any other Business Intelligence tool. It would be essential for yourself to get a good understanding of business processes you are trying to present and creatively find the best way to show the interactions and connections between them making sure that you put all the necessary information in there.
Next time I’m planning to talk about an example of how to display complex data in a simple way.