Business Intelligence & Data Visualisation

Transform your data into actionable insights

Have more information than ever, yet struggle to use it efficiently? If you collect data from dozens of sources, yet decisions still depend on static reports, or they display information that nobody uses, you need Qurious Solutions’ Business Intelligence and Data Visualisation services to turn complex data into clarity.

We build dashboards and data analytics that your team actually uses – transforming raw data into decisions that drive business outcomes.

Why companies need Business Intelligence

Organisations investing in analytics solutions see average returns of $13.01 for every dollar invested.

Business Intelligence can deliver a dramatic business impact:

  • Accelerate your decision-making to take minutes instead of days; up to 5x faster than competitors

  • Improve decision accuracy and streamline data metrics

  • Uncover revenue growth and cost reduction opportunities

  • Enable real-time response to market changes, operational issues, and customer behaviour

  • Companies using advanced analytics are 5x more likely to exceed financial targets

Why choose Qurious Solutions for Business Intelligence & Data Visualisation services

Comprehensive enterprise data solutions for Australian businesses.

We understand the regulatory environment and compliance requirements specific to Australian enterprises. We have delivered over 200 projects for multiple sector clients – mining companies, financial services, retail and logistics, healthcare, government and utilities – from ASX-listed giants to small businesses. No job is too big or too small.

Technology-agnostic. Results-focused.

The right platform depends on your situation—whether implementing Qlik Sense, Tableau, Power BI, or custom solutions, we recommend based on your requirements and business context, not our preferences.

Qurious Solutions delivers projects faster and more cost-effectively by focusing on best-in-class solutions of today, not replicating what was used yesterday. We focus on real business needs, leverage modern platforms’ capabilities, and avoid unnecessary complexity – so you get solutions that deploy quickly and drive real adoption.

Examples of
Qurious Solutions' Dashboards

Our BI & Data Visualisation Services:

You can’t build dashboards before you understand what questions need answering. We start with a strategic assessment:

  • Discovery workshops to understand business challenges, decision-making processes, and critical questions
  • Current state assessment: existing dashboards, reports, and analytics capabilities
  • Identify data silos, inconsistent metrics, and reporting inefficiencies
  • Define 5-8 core metrics that drive business decisions aligned with strategy
  • Assess current BI tools; recommend upgrades, additions, or replacements
  • Build a realistic implementation plan with quick wins, timeline, and investment

The right data foundation enables effective BI. We design and implement platforms that support analytics at scale:

  • Data integration from multiple sources (ERP, CRM, databases, cloud applications, APIs)
  • Streaming data for dashboards that update in real time
  • Create unified business definitions for key metrics
  • Build architecture that grows from 10 users to 1,000 without performance degradation
  • Implement validation and cleansing so analytics are trusted
  • Performance optimization

We are platform agnostic and implement the tech stack that works best for your organisation:

  • Qlik: Associative engine; strong for exploration and discovery
  • Microsoft Power BI: Deep integration with Microsoft ecosystem; best-in-class value
  • Tableau: Drag-and-drop design; strongest visualization capabilities
  • Databricks: Advanced analytics and ML; handles structured and unstructured data
  • Is your tool not listed above? Our data engineers are extremely well-versed in a broad range of tools. Reach out to us for a detailed discussion

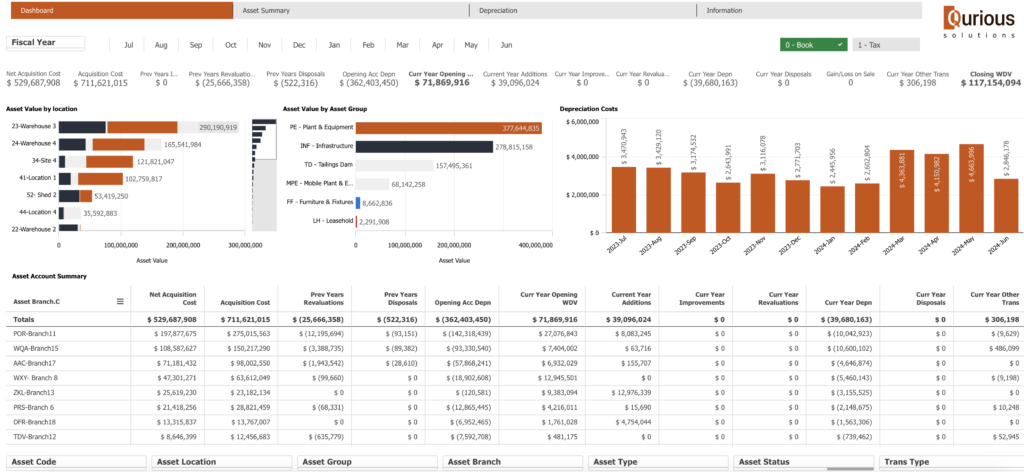
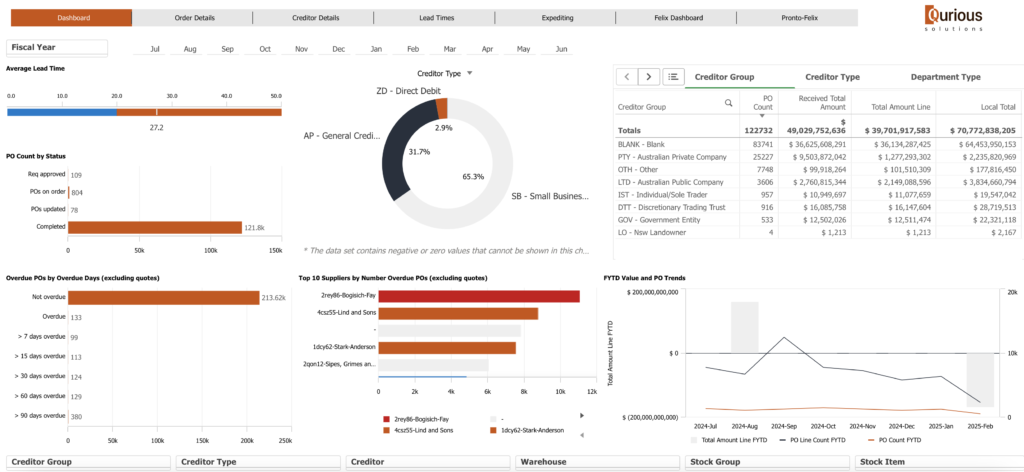
Beautiful dashboards that nobody uses are expensive mistakes. We design dashboards around actual user workflows and decision-making:

  • User workshops to understand their workflows, questions, and pain points
  • Wireframe dashboard layouts with user input
  • Iterative development: build, test, refine based on user feedback
  • Performance optimisation
  • Documentation to help users understand how to interpret and act on insights
  • Hands-on training to build in-house capabilities

We build governance, ensuring your dashboards are built on reliable data:

  • Automated checks ensure dashboards alert to data issues
  • Metadata management: what data means, where it comes from, who owns it
  • Access controls & security, ensuring users see appropriate data
  • Ensure compliance with Privacy Act, APPs, and industry regulations
  • Assign clear ownership for data quality and governance
  • Track changes to dashboards and underlying data

Move from “what happened” to “what will happen” and “what should we do.” Advanced analytics unlock competitive advantage:

  • Predictive modelling: Forecast customer churn, equipment failures, inventory needs with accuracy
  • Machine learning: Leverage historical patterns to identify opportunities and risks automatically
  • Prescriptive analytics: Recommend specific actions to achieve business outcomes
  • Anomaly detection: Automatically flag unusual patterns deserving attention
  • Scenario modelling: Run “what-if” analyses to evaluate business decisions
  • Cohort analysis: Compare customer segments; understand what drives differences

Real-World Applications:

  • Retail: Demand forecasting reduces inventory carrying costs by 15-20%; supply chain optimisation saves millions
  • Financial Services: Fraud detection models prevent millions in losses; churn prediction enables proactive retention
  • Manufacturing: Predictive maintenance reduces unplanned downtime by 30-40%; quality prediction improves product reliability
  • Consumer services: Churn prediction, propensity modelling, customer lifetime value optimisation

Best analytics strategy doesn’t scale if only a few people can create reports. We build capability across your organisation:

  • Role-based training
  • Hands-on workshops
  • Documentation & guides using video tutorials, quick-reference guides, and FAQ addressing common tasks
  • Ongoing support available
  • Regular seminars introducing new capabilities
  • Share best practices across the organization

Common questions about BI & Dashboards

Most organisations see meaningful impact within just two weeks of the project start. This is vastly different from the industry-standard 2-6 months! Our phased approach focuses on delivering value early while building toward longer-term analytics maturity. Our secret is an experienced and agile team, focused on business outcomes and clients’ interests in mind.

Investment varies based on complexity, ranging from $25,000 to $500,000+. Variables affecting cost can be the complexity of data integration, the number of dashboards and users, the platform choice, the implementation scope and the timeline.

Most clients see ROI within 2-6 months through operational efficiency gains, faster decision-making, and improved business outcomes.

No. BI works alongside your existing systems (ERP, CRM, HR systems, etc.). We integrate data from these systems rather than replacing them. Your current investments remain in place; BI adds a layer of analytics on top.

Poor data quality is extremely common. Data quality issues are never a blocker for BI implementation. We help identify quality issues, implement cleansing processes, and establish ongoing governance to improve data quality over time. Quality improvement happens as part of the implementation, not as a prerequisite.

Absolutely. We intentionally build internal capability through:

  • Training: Your team learns the platform and best practices
  • Documentation: Standard procedures, common tasks, troubleshooting guides
  • Centre of Excellence: Establish an internal team managing governance and best practices
  • Ongoing support: We provide 12 months of support post-launch, then transition to self-sufficiency

Clear success metrics are established upfront and tracked:

  • Adoption: % of intended users actively using dashboards (target: 70%+)
  • Speed: Time from “I need to know X” to “here’s the answer” (target: reduce by 80%+)
  • Impact: Revenue growth, cost reduction, efficiency gains measured against baseline (target: 10%+ improvement)
  • Satisfaction: User satisfaction and Net Promoter Score (target: 8+/10)

Ready to get started with your data strategy?

Schedule a consultation (30 minutes, no obligation)

  • Discuss your current analytics challenges and business objectives
  • Learn how enterprise peers transformed their companies with business intelligence
  • Explore which Business Intelligence approach is the right investment for you

The website uses cookies to ensure  you get the best experience on our website. To find out more read our Privacy Policy